Joshua Shepherd analysed public spending in Sheffield in order to understand the impact of the UK's centralised system on local communities.
Author: Joshua Shepherd
The UK is the most centralised welfare state in the world. However within the UK this fact is rarely recognised and is often misunderstood. It is commonly and falsely assumed that power rightly belongs at the centre and that one of the benefits of centralisation is that it enables the fair distribution of resources to local areas. However, in reality excessive centralisation can often mean taking appropriate power away from local communities and spending resources at the centre rather than distributing those resources fairly to local communities.
In this article Joshua Shepherd, building on our previous analyses of the local economies in Barnsley and Calderdale, examines how public expenditure is distributed and controlled in the City of Sheffield.
The purpose of this research is to help understand public expenditure in Sheffield and its relationship to central government. While there is a yearly analysis provided by the Treasury that looks at public expenditure on a UK wide and regional level (HMT 2019) there is, unfortunately, no equivalent analysis that details spending on a local authority level. Therefore, one of the main challenges of this research has been to gather the relevant data, and this data has had to be extracted from a wide variety of central and local sources and combined together.
The accompanying spread sheet available to view here goes into detail on how the total expenditure figure was arrived at and offers a comprehensive and hopefully transparent breakdown of spending on each service and sources (both central and local) used.
Our main findings are as follows:
However selecting the correct figure for UK public expenditure in total has been surprisingly difficult. We would welcome feedback and advice on this issue and on any other data issue and will amend this article accordingly.
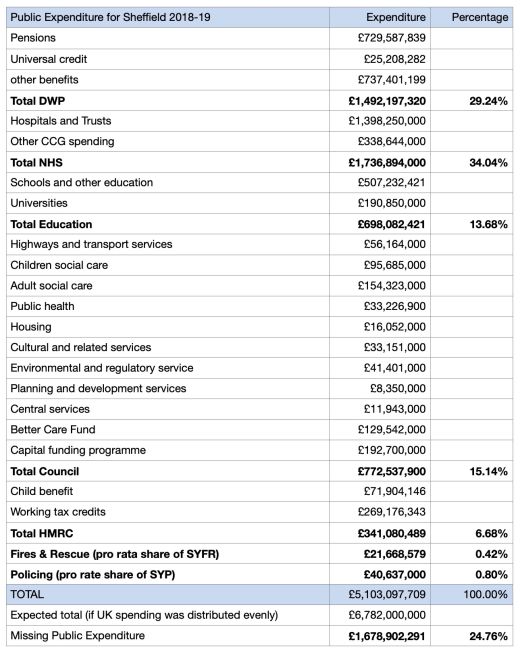
Table 1 Public spending in Sheffield
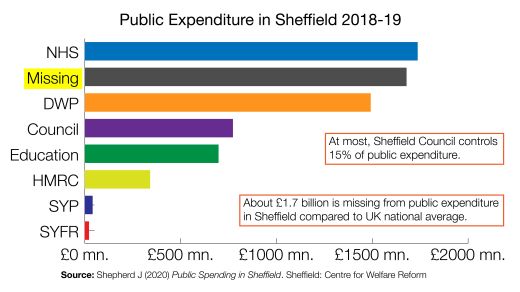
Figure 1 Public Expenditure in Sheffield 2018-19
As Table 1 illustrates, public spending in Sheffield based on the available data is around £5.1 bn. although this list is not exhaustive. In order to ascertain the level of public expenditure the city of Sheffield should be receiving it is necessary to compare it with overall UK public expenditure in 2018-19. According to the Office for National Statistics (ONS, 2019a) total expenditure on services, which includes both identifiable and non-identifiable expenditure totalled £773.064 bn. The UK population based ONS estimates (ONS, 2018) is 66.4 mn. resulting in an average per capita spend of around £11,642 (UK spending/UK population). Therefore, if UK public spending were distributed evenly by population, public expenditure in Sheffield would be around £6.782 bn. which suggests that £1.678 bn. is missing from the public economy.
This large discrepancy between actual and expected spend equates to the citizens of Sheffield receiving £2,881 per person less than expected, as per capita spend in Sheffield appears to be £8,761 compared to the UK average of £11,642. This finding echoes previous research which also found significant amount of missing public funding in the Yorkshire region – with Barnsley and Calderdale missing £750 mn. and £935 mn. respectively (Duffy & Hyde 2011, Duffy 2017).
This missing expenditure is also set against a backdrop of a decade of austerity and severe cuts to public services following the 2008 financial crisis. These cuts were so severe that the United Nations has accused the UK of breaching its human rights obligations (UN, 2016). Many researchers have also shown that a disproportionate number of the cuts target vulnerable groups, local government and the North (Hastings et al. 2015; Raikes & Johns 2019; Duffy 2014). Moreover discussions on public spending often imply that somehow public finances are adjusted to transfer more money to more deprived areas. Given that Sheffield (like Barnsley and Calderdale) are areas with more deprivation than the national average it is clear that no such adjustment has taken place in these areas.
If we carry out the same analysis using the data available on public expenditure as a percentage of Gross Domestic Product (GDP) then the expected total spending and the missing public spending analysis is almost exactly the same (see Table 2).
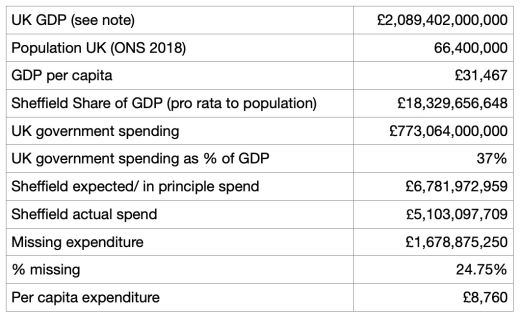
Table 2 Analysis of public expenditure missing from Sheffield
It is important to note that actual spending in Sheffield will be somewhat higher than the £5.1 bn. figure. For example, money spent on services such as prisons and courts is missing from this analysis as no local data could be identified (a fact which also raises the separate issue of the opaque nature of public finances in general). If this data was included it would increase the accuracy of the model. However, even if this data were included it is highly doubtful whether it would explain the large discrepancy between actual and expected public expenditure.
Similarly, previous research on MoD spending proposed that £65.34 mn could be assigned to Sheffield as its share of national defence expenditure (McGough and Swinney, 2015; MoD 2019). However this money is not actually being spent in the Sheffield economy and so it has no economic benefit for the City (whatever the defence benefit). None of this is to suggest that there is no case for expenditure to take place outside Sheffield or that UK national expenditure could or should be spread evenly. However spending is taking place somewhere. Some communities benefit and some lose out and Sheffield is clearly a loser - and to a very high degree.
A more significant caveat to this research is that the missing public expenditure in Sheffield figure fluctuates depending on what figure for overall UK public spending data is put into the model. For instance, in this research, the total expenditure figure of £773.064 bn. was used. However, as illustrated by Table 3 there can be wide variations if we use other Treasury data instead [‘total identifiable’ or ‘total managed’ expenditure].

Table 3 Impact of applying lower levels of public expenditure
In reality local government has limited autonomy and limited control over how public money is spent in Sheffield.
To illustrate:
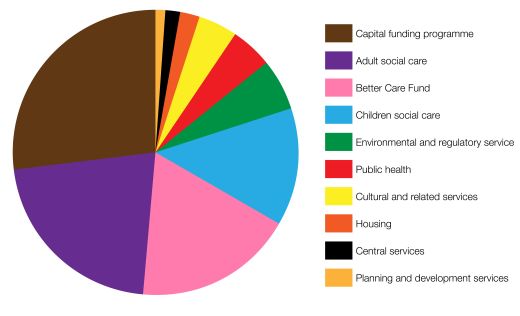
Figure 2 Expenditure controlled by Sheffield Council
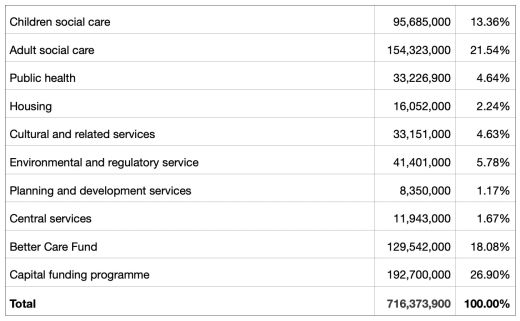
Table 4 Expenditure controlled by Sheffield Council
Around 15% of all public spending is controlled by Sheffield City Council, which seems a small figure and raises important questions about democratic control of public resources. This 15% figure is probably too high because a significant part of that funding is made up of the Better Care Fund (BCF) budget between SCC and Sheffield CCG, and it does not have complete control on how this fund is spent as a condition of accessing the money in the fund is that CCG’s and Sheffield council have to jointly agree plans for how the money will be used – and these plans must meet particular requirements (Department of Health and Social Care and Ministry of Housing, Communities and Local Government an 2019). Therefore, if BCF expenditure were deemed not to be under Council control, then Council total expenditure would be in reality £642.995 mn. and would only account for 12.93% of all public spending in Sheffield.
All of this adds to the concerns and raises profound issues about the centralisation of power by central government and does little to dispel arguments that the UK is one of the most centralised welfare states in the developed world, with key decisions still made by remote politicians (Raikes et al 2019). Indeed, it appears Sheffield City Council have little power and control of resources used on services, despite having a larger population than entire countries such as Iceland and Malta.
This centralisation of resources and power appears to be mirrored by the local authority’s governance structure, specifically the ‘strong leader’ model whereby the majority of important decisions are made either by the council leader or one of the ten members of the city’s cabinet, which in affect excludes the other 75 councillors in Sheffield from the decision making process. This top down approach is seen by some to decrease public engagement in democracy and makes it difficult for local citizens to get their concerns heard as most councillors don’t have to the power to work on behalf of the people they represent (It’s Our City 2018; Bennett 2018).
However, the recent Sheffield City region devolution deal will bring some more power and resources and resources under local control. Nevertheless, as it stands, as shown in this research Sheffield does not get a proportional share of national resources, and of the small percentage (15%) SCC does control, the citizens of Sheffield do not get a significant say in how this should be deployed to meet local needs.
Bennett N (2018). Sheffield needs accountability not “strong leader” model
https://leftfootforward.org/2018/07/sheffield-needs-accountability-not-strong-leader-governance/
Department of Health and Social Care (DHSC) and Ministry of Housing, Communities and Local Government (MHCLG) (2019). Better care fund planning requirements 2019-20
Department for Work and Pensions (DWP) (2019). Benefit expenditure by local authority 2002/03 to 2018/19. https://www.gov.uk/government/publications/benefit-expenditure-and-caseload-tables-2019
Department for Work and Pensions (DWP) (2020). Stat-xplore.
https://stat-xplore.dwp.gov.uk/webapi/jsf/login.xhtml
Duffy S (2017). Heading upstream; Barnsley’s innovation for social justice. Centre for Welfare Reform. https://www.centreforwelfarereform.org/uploads/attachment/585/heading-upstream.pdf
Duffy S (2014). Counting the cuts: what the government doesn’t want you to know. Centre for Welfare Reform. https://www.centreforwelfarereform.org/uploads/attachment/403/countingthe-cuts.pdf
Duffy S & Hyde C (2011). Women at the centre; innovation in the community. Centre for Welfare Reform. https://www.centreforwelfarereform.org/uploads/attachment/429/women-at-the-centre.pdf
Hastings A, Bailey N, Bramley G, Gannon M & Watkins D (2015). The cost of the cuts: the impact on local government and poorer communities. Joseph Rowntree Foundation. https://www.jrf.org.uk/sites/default/files/jrf/migrated/files/CostofCuts-Full.pdf
HM Revenue and Customs (HMRC) (2019). child and working tax credit statistics finalised annual awards in 2017 to 2018 geographical analysis.
HM Revenue and Customs (HMRC) (2019). HMRC Child benefit statistics geographical analyses tables: August 2018. https://www.gov.uk/government/statistics/child-benefit-statistics-geographical-analysis-august-2018
HM Treasury (HMT) (2019). Public expenditure statistical analysis 2019
https://www.gov.uk/government/statistics/public-expenditure-statistical-analyses-2019
It’s our city (2018) Sheffield’s People Petition https://www.itsoursheffield.co.uk/petition/
McGough L & Swinney P (2015). Mapping Britain’s Public Finances. Centre for Cities. https://www.centreforcities.org/publication/mapping-britains-public-finances-where-is-tax-raised-and-where-is-it-spent/
Ministry of Defence (MoD). Ministry of Defence, Annual report and Accounts 2018-2019
Ministry of Housing, Communities and Local Government (MHCLG) (2019). Local authority expenditure and financing England: 2018 to 2019 outturn. https://www.gov.uk/government/statistics/local-authority-revenue-expenditure-and-financing-england-2018-to-2019-individual-local-authority-data-outturn
NHS England (2020). Infographics: fair shares - a guide to NHS allocations. https://www.england.nhs.uk/publication/infographics-fair-shares-a-guide-to-nhs-allocations/
NHS Sheffield CCG (2019). Finance report 2018/19.
Office for National statistics (2019b). Gross Domestic Product: chained volume measures: seasonally adjusted £m. https://www.ons.gov.uk/economy/grossdomesticproductgdp/timeseries/abmi/pn2
Office for National statistics (ONS) (2018). UK Population Pyramid interactive.
Office for National Statistics (ONS) (2019a). Country and regional public sector finances; financial year 2019
Raikes L, Giovannini A & Getzel B (2019) Divided and connected: regional inequalities in the north, the UK and developed world, state of the north 2019. Institute for Public Policy Research. https://www.ippr.org/files/2019-11/sotn-2019.pdf
Raikes L and Johns M (2019) The Northern Powerhouse: 5 years in. https://www.ippr.org/blog/the-northern-powerhouse-5-years-in
Sheffield Children's NHS foundation trust (2019). Annual report and accounts 2018/2019 https://www.sheffieldchildrens.nhs.uk/download/272/publications/8912/annual-report-2018-19.pdf
Sheffield City Council (2018). School budgets: 251 budget statement 2018-2019
https://www.sheffield.gov.uk/home/schools-childcare/school-budgets
Sheffield Hallam University (2019). Annual report and financial statements 2018/2019
https://www.shu.ac.uk/~/media/home/about-us/governance-and-strategy/files/annual-report-and-financial-statements-2018-19.pdf
Sheffield Health and Social Care NHS Foundation Trust (2019). Annual report and accounts 2018-2019
https://www.shsc.nhs.uk/sites/default/files/2019-12/Annual%20Report%202018-2019.pdf
Sheffield Teaching Hospitals NHS foundation trust (2019). Annual report and accounts 2018-19.
South Yorkshire Fire and Rescue (2019) Statement of assurance and annual report. http://www.syfire.gov.uk/wp-content/uploads/2019/09/Statement_of_Assurance_and_Annual_Report.pdf
South Yorkshire Police (2019) Chief constable of south Yorkshire statement of accounts 2018/2019. https://www.southyorks.police.uk/media/4308/syp-force-annual-accounts-2018-19-final-230719.docx
United Nations (2016) Committee on economic, social and cultural rights: concluding observations on the sixth periodic report of the united kingdom of great Britain and northern Ireland. http://media.wix.com/ugd/8a2436_6c461f9046454918a815e7b51807c710.pdf
University of Sheffield (2019). Annual report and financial statements 2018/2019
https://www.sheffield.ac.uk/finance/finstatements
The publisher is the Centre for Welfare Reform.
Public Spending in Sheffield © Joshua Shepherd 2020.
All Rights Reserved. No part of this paper may be reproduced in any form without permission from the publisher except for the quotation of brief passages in reviews.
local government, England, Article