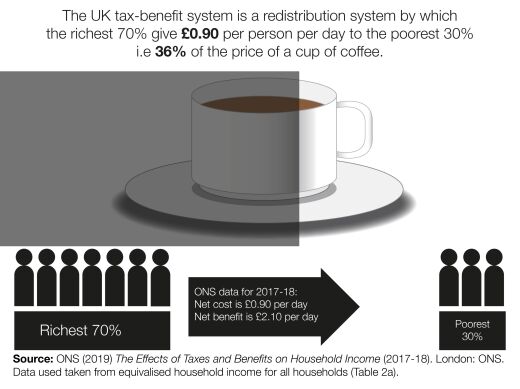
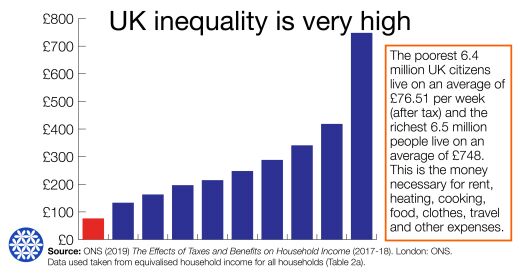
Infographics showing how poverty is created by the unfairness of the UK tax-benefit system.
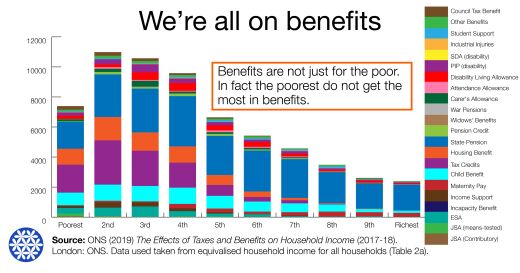
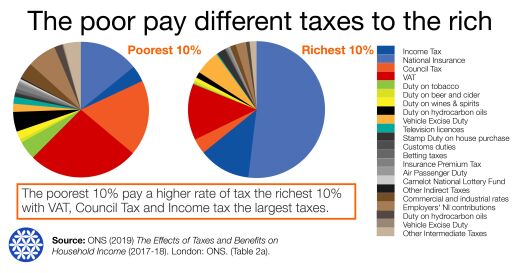
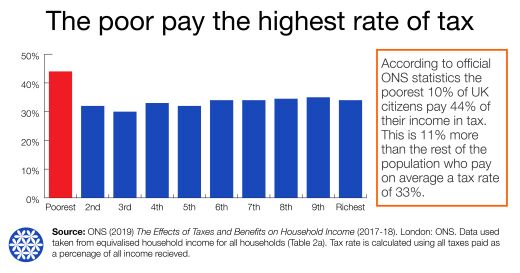
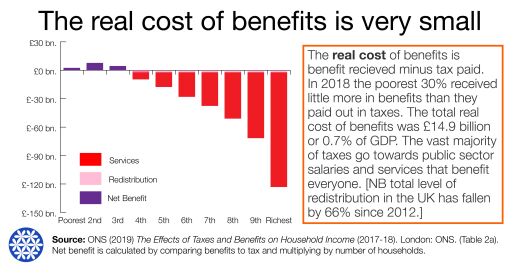
These infographics were developed by Simon Duffy using Office for National Statistics (ONS) data on income distribution, taxes and benefits. Contrary to widely held beliefs the tax and benefit system (taken together) is profoundly unfair to the poorest in the UK. This data is from the tax year ending in 2018.
The publisher is Citizen Network Research. UK Poverty Data in Graphics © Simon Duffy 2012-2020
All Rights Reserved. Please reference the authors and the publisher if you use them.
Basic Income, politics, social justice, tax and benefits, England, Northern Ireland, Scotland, Wales, Album