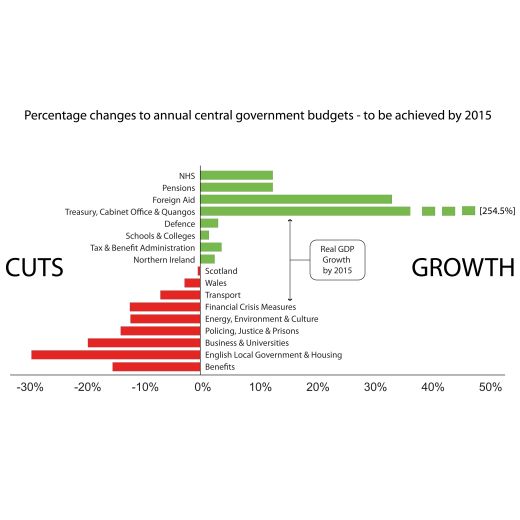
This graph shows the percentage of cuts to be achieved by 2015 in various areas.
The current UK government has launched an unprecedented range of cuts in public services - to run from 2010 to 2015. But not everything is to be cut. The biggest percentage cuts are to benefits and local government - ordinary people in local communities. The larger percentage increase is in the Cabinet Office, The Treasury and new Quangos - the centre of central government.
The publisher is The Centre for Welfare Reform.
Graphic on Percentage UK Cuts by 2015 © Simon Duffy 2012.
All Rights Reserved. No part of this paper may be reproduced in any form without permission from the publisher except for the quotation of brief passages in reviews.
Cumulative Impact, local government, social justice, England, Graphic