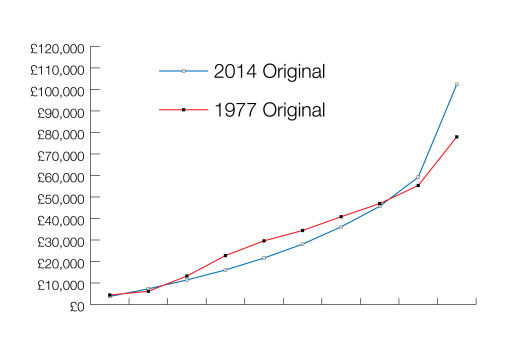
Between 1977 and 2014 the most dramatic changes incomes were of the richest, whose incomes increased radically, and for middle-income groups where incomes fell
Between 1977 and 2014, and before the application of benefits and taxes, incomes for most people have fallen. Only the top 20% have seen any real increase and most have that increase has been for the top 10% of families.

The publisher is the Centre for Welfare Reform.
Graphic on Changing Income Distribution (1977-2014) © Simon Duffy 2017.
All Rights Reserved. No part of this paper may be reproduced in any form without permission from the publisher except for the quotation of brief passages in reviews.
social justice, tax and benefits, Graphic