Simon Duffy pulls together some of the key data relevant to the Centre's submission to the Parliamentary Inquiry on adult social in England.
Author: Simon Duffy
This information sheet was prepared as part of the Centre's submission to the Parliamentary Inquiry on Adult Social Care in August 2016. It summarises some of the most important facts about social care and identifies key trends.
There have been five key trends in adult social care since the late 1970s:
The first development was the creation in 1980 of a government subsidy called Board & Lodging for service providers offering residential care. Until that point residential care was the most significant service provided to older people if they needed additional support. Some people purchased their own care privately, but most relied on local government to provide or fund that care.
Board & Lodging was an entitlement that could only be claimed by any independent organisations (non-profit and profit-making) running residential or nursing homes. Naturally this encouraged significant growth in residential and nursing care. Between 1980 and 1990 residential and nursing care increased by 84% from 241,400 places to 444,300 places.
Clearly this policy was also meant to advance the policy goals of the UK Government by increasing the level of non-statutory service provision. However the policy also has all the appearance of a policy accident. For it dramatically increased spending on health and social care at a time when Government was explicitly trying to reduce the cost of public services. So, in 1992 the system was changed and local authorities (about 150 in England) were given the responsibility for managing adult social care budgets. The open-ended entitlement to residential care was ended; funding was capped and the aggregate was transferred into local government control, but with no ring-fencing.
The concept of adult social care only really came into existence as part of the changes created by the 1990 NHS & Community Care Act. From that point on local government was given nominal leadership for social care in England, yet policy was increasingly driven by central government. In particular central government pushed local government to privatise their own services and to tender for services according to rules which pushed down costs, increased standardisation and damaged the development of community-based or innovative supports (Howells & Yapp 2013).
There was also an ongoing focus on increasing the level of care at home in order to reduce the demand for residential care and to help people return home safely from hospital. However, publicly funded home care was also subjected to these same contracting practices, which have reduced flexibility and personalisation (Angel 2012).
The next major change in government policy was the creation of direct payments in 1996. This legislation allowed people to request that their entitlement to support be converted into a cash payment that they could then use to purchase their own support (HMSO 1996). The original legislation was narrow in scope, limited to adults with physical disabilities under 65, however its scope was progressively widened to include older people, children and other groups. This policy breakthrough followed significant campaigning by people with disabilities (Glasby & Littlechild 2009).
The logical continuation of this policy came with the development of a policy of personal budgets. Personal budgets were designed to give all those eligible for social care a clear and individualised entitlement to support. People would then get choice and control over how the budget was managed. This policy was based on my own work with people with learning disabilities at Inclusion Glasgow, where we discovered the advantages of giving people, families and professionals a needs-based budget with which to plan and develop more flexible assistance (Fitzpatrick 2010; Animate 2014).
Building on this idea, the In Control project was formed in order to redesign the care management process for adult social care (Duffy 2004). Eventually, after the success of early piloting, the Government made an explicit commitment to personal budgets in Putting People First and in subsequent legislation. (HM Government 2007, HM Government 2014). Scotland adopted these ideas also, although they have not extended to Wales or Northern Ireland (Scottish Parliament 2013). Subsequently these ideas have spread from social care into healthcare, education and support for children (Needham & Glasby 2014).
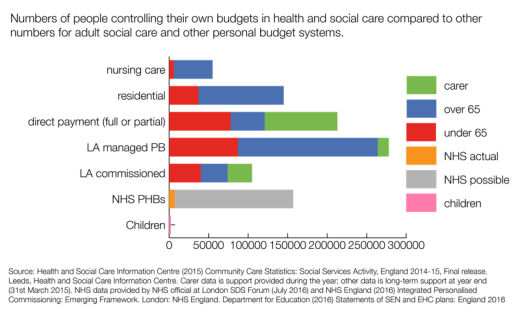
Today there are 43,000 people over 65 managing a direct payment, which is 10% of the total number receiving long term support (HSCIC 2015). A further 177,000 people (43%) have a personal budget managed by their social worker, although in practice it is not clear how much additional flexibility or responsiveness this really provides. Unfortunately there has been little recognition of the need to use systems like ISFs that give a combination of flexibility and enable share management of responsibilities.
| Type | 18-64 Yrs. | % | 65+ Yrs. | % | Total | % |
| Nursing Care Homes | 6,000 | 2% | 49,000 | 12% | 55,000 | 8% |
| Residential Care Homes | 37,000 | 15% | 108,000 | 26% | 145,000 | 22% |
| Direct Payments - full | 59,000 | 24% | 33,000 | 8% | 92,000 | 14% |
| Direct Payments - part | 19,000 | 8% | 10,000 | 2% | 29,000 | 4% |
| LA Managed Budgets | 87,000 | 35% | 177,000 | 43% | 264,000 | 40% |
| Other Services | 40,000 | 16% | 34,000 | 8% | 74,000 | 11% |
| TOTAL | 248,000 | 411,000 | 659,000 |
Table 1. Breakdown of different types of adult social care expenditure in England
In addition, as we can see from Figure 1, there are now new kinds of personal budget emerging, albeit slowly, in health and education services.

Figure 1. Use of personal budgets across social care (adults and children) and health
Since 2010 the UK Government began a programme of radical cuts to funding for public services, particularly targeted on local government and working age and disability benefits. The cuts in social care have been very significant as eligibility criteria and means-testing have increased. The number of people who received a social care service from English councils fell by 509,000 (29%) from 2008-9 to 2013-14 (HSCIC, 2014)
There is also significant evidence that disabled people (including older people with disabilities) have been targeted for cuts, for cuts in social care have been combined with a wide range of cuts in disability benefits and other harmful policies (Duffy 2013).
One of the interesting features of this period has been the sharp dichotomy between the rhetoric of community care and the reality of institutional provision. Even today, after more than 25 years of policy to promote community care and ensure people get support in their own home the official data suggests that spending on institutional care is very significnat. In 2014-15, HSCIC figures (HSCIC, 2015b) show that the proportion of English councils’ adult social services expenditure spent on residential care was 40% (£6.8 billion).
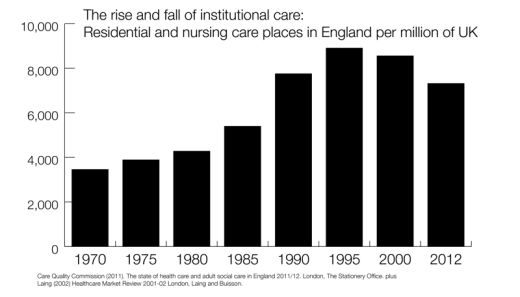
However, if we combine the most recent data from the Care Quality Commission with historical data then we can see that the previous increases in residential and nursing care home places are now in reverse. Today there are at least 50,000 fewer care home places, despite a growth in the UK population.
| YEAR | Care Homes | UK Population (Mn.) | Per Million |
| 1970 | 192,800 | 55.66 | 3,464 |
| 1975 | 219,100 | 56.23 | 3,896 |
| 1980 | 241,400 | 56.31 | 4,287 |
| 1983 | 265,500 | 56.33 | 4,713 |
| 1985 | 305,500 | 56.55 | 5,402 |
| 1987 | 352,600 | 56.80 | 6,208 |
| 1990 | 444,300 | 57.25 | 7,761 |
| 1995 | 517,000 | 58.02 | 8,911 |
| 1998 | 523,600 | 58.49 | 8,952 |
| 2000 | 504,300 | 58.89 | 8,563 |
| 2012 | 463,287 | 63.26 | 7,324 |
Table 2. The rise and fall of residential care
There are a number of forces at work here. Local government largely ended the growth in residential and nursing care when it took over control of its funding in 1992. Growth in more personalised support may also have reduced the demand for more institutional options. However the extreme funding cuts now being carried out in England must also be a factor. For some older people, who continue to want to avoid residential care, this reduction of places is probably welcome (CSCI 2004). However for many businesses, especially private sector business who borrowed heavily to invest in what they took to be a growing business, these changes may seem more like a crisis (Jackson 2015).

Figure 2. The rise and fall of residential care
Angel C (2012) Care is Not a Commodity. London, UKHCA.
Animate (2014) Individual Service Funds. Sheffield, Centre for Welfare Reform.
CSCI (2004) When I Get Older. London, Commission for Social Care Inspection.
Duffy S (2004) ‘‘In control’’, Journal of Integrated Care, Vol. 12 No. 6, pp. 7-13.
Duffy S (2013) A Fair Society? How the cuts target disabled people. Sheffield, Centre for Welfare Reform.
Fitzpatrick J (2010) Personalised Support: How to provide high quality support to people with complex and challenging needs - learning form Partners for Inclusion. Sheffield, Centre for Welfare Reform.
Glasby J & Littlechild R (2009) Direct Payments and Personal Budgets - Putting Personalisation into Practice. Bristol, The Policy Press.
HM Government (2007) Putting People First. London, HM Government.
HM Government (2014) Care Act 2014
HMSO (1996) Community Care (Direct Payments) Act 1996. London, HMSO.
Howells C & Yapp C (2013) Commissioning and Community Sourcing. Sheffield, Centre for Welfare Reform.
HSCIC (2014) Community Care Statistics: Social Services Activity, England 2013-14, Final release. Leeds, Health and Social Care Information Centre.
HSCIC (2015a) Community Care Statistics: Social Services Activity, England 2014-15, Final release. Leeds, Health and Social Care Information Centre.
HSCIC (2015b) Personal Social Services: Expenditure and Unit Costs, England 2014-15 Final release. Leeds, Health and Social Care Information Centre.
Jackson R (2015) Who Cares? The impact of ideology, regulation and marketisation on the quality of life of people with learning disabilities. Sheffield, Centre for Welfare Reform.
Needham C and Glasby J (eds.) (2014) Debates in Personalisation. Bristol, Policy Press.
Scottish Parliament (2013) Social Care (Self-Directed Support) Act 2013
The publisher is the Centre for Welfare Reform.
Data on Social Care in England © Simon Duffy 2016.
All Rights Reserved. No part of this paper may be reproduced in any form without permission from the publisher except for the quotation of brief passages in reviews.
local government, social care, social justice, Article